Quick Navigation:
| | | | |
Quick Navigation:
| | | | |
Chapter 24: Data Handling (Statistics)
Overview: This chapter covers the basics of Statistics, including the collection and organization of data, frequency distributions, and graphical representations such as Bar Graphs and Pie Charts.
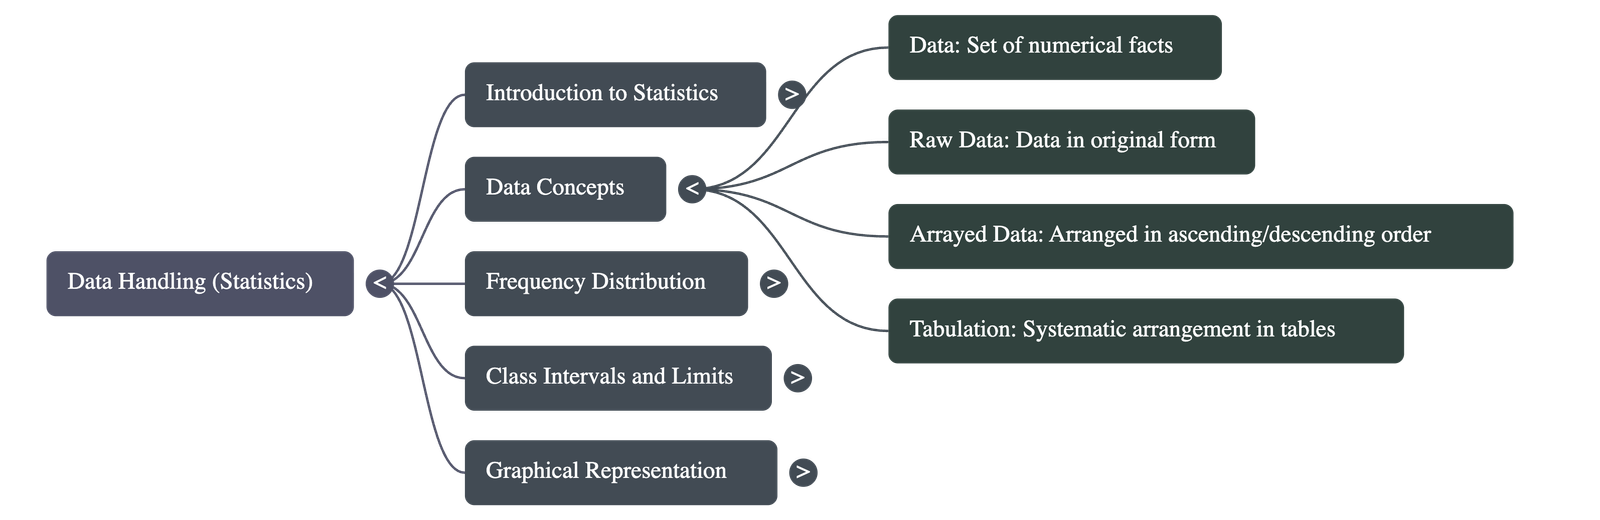
1. Introduction to Statistics and Data
- Definition of Statistics: The term is used in two senses:
- Singular sense: The subject or branch of knowledge dealing with collecting, analyzing, presenting, and interpreting numerical data.
- Plural sense: The collection of numerical data with a definite object in view (e.g., population statistics, tax data).
- Data: A set of numerical facts collected with a specific objective.
- Tabulation: The systematic arrangement of data, generally in the form of a table, to make it easier to understand.
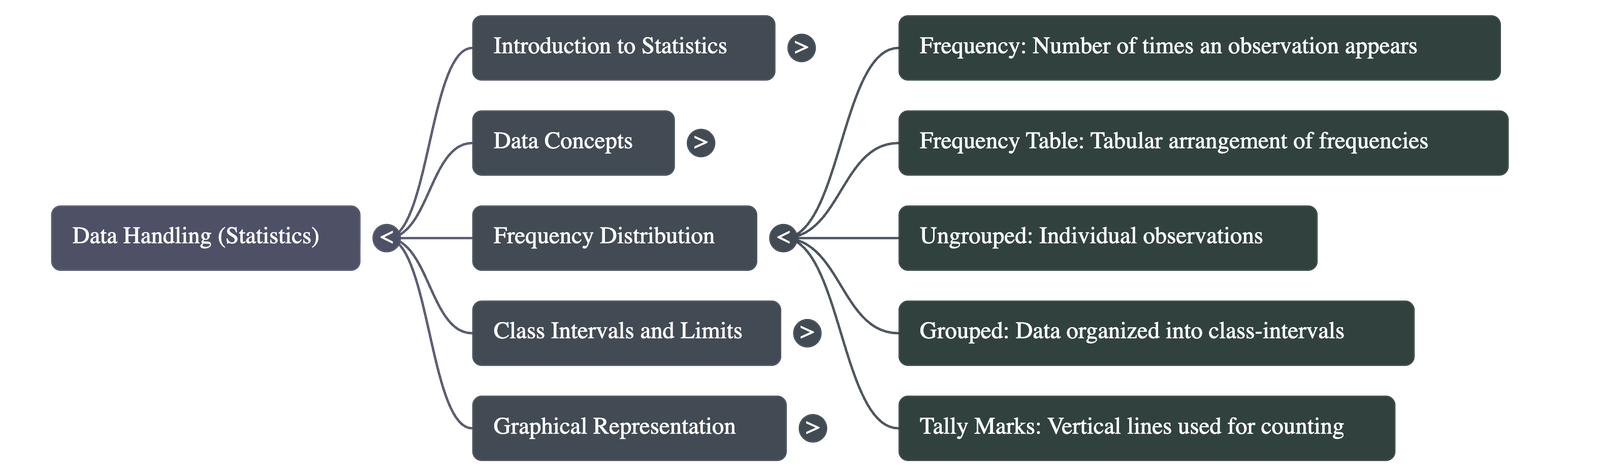
- Frequency: A number that tells how many times a particular data point (observation) appears in a given set.
2. Organization of Data
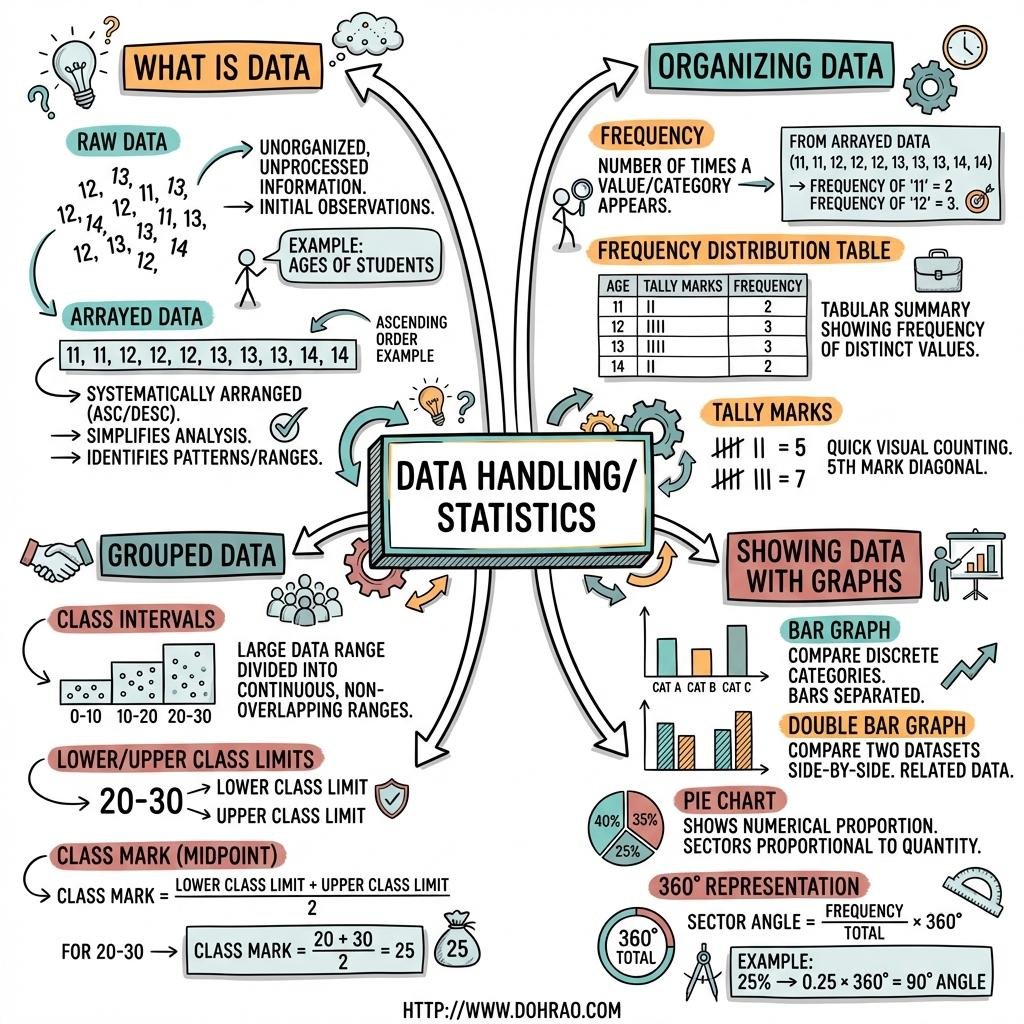
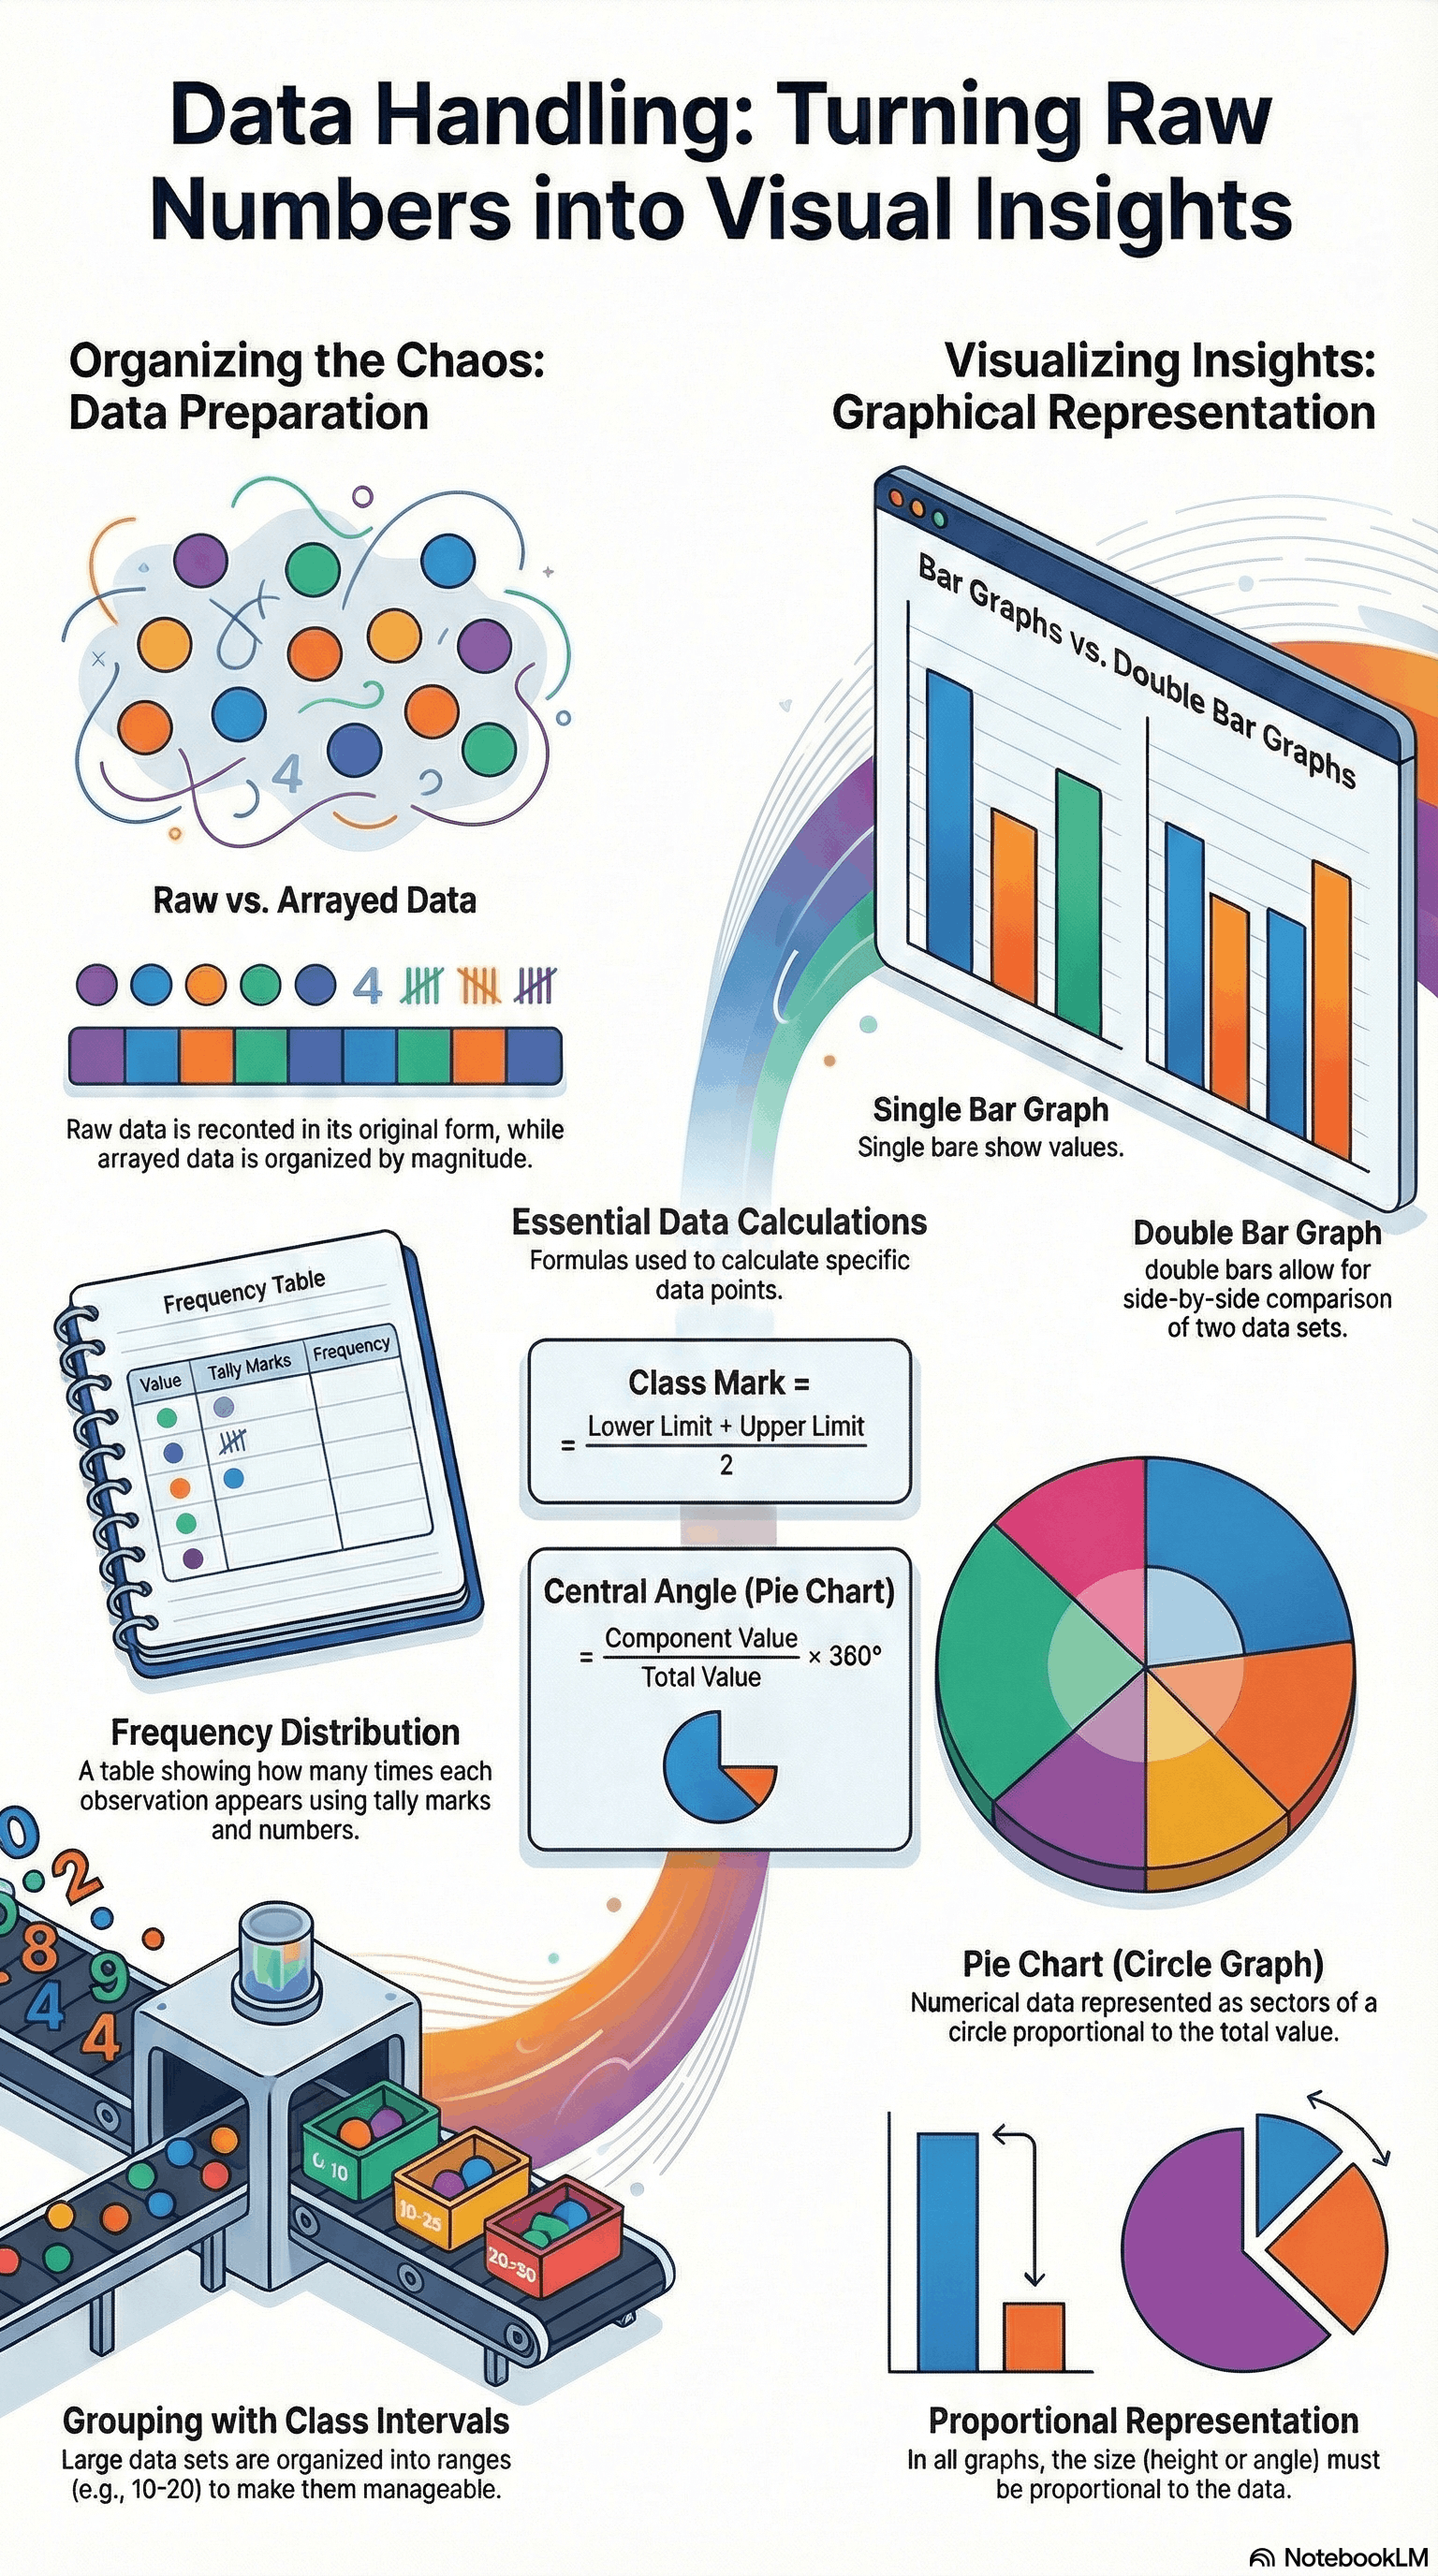
- Raw Data: Data recorded in its original form as it is collected.
- Arrayed Data (Array): Data arranged in ascending or descending order of magnitude.
- Frequency Distribution: A tabular arrangement showing the frequency of each number or observation.
- Constructing a Table:
- Data is often organized using a "Tally Marks" column.
- Tally marks are grouped in bundles of five (four vertical strokes crossed by a diagonal stroke).
3. Grouped Frequency Distribution
- Class-Interval: When data is large, it is grouped into ranges (e.g., 10-20, 20-30).
- Class Limits: The boundaries of a class interval.
- Lower Class Limit: The smaller number in the interval (e.g., 10 in 10-20).
- Upper Class Limit: The larger number in the interval (e.g., 20 in 10-20).
- Class Mark: The value midway between the lower and upper class limits.
Class Mark = (Lower Class Limit + Upper Class Limit) / 2
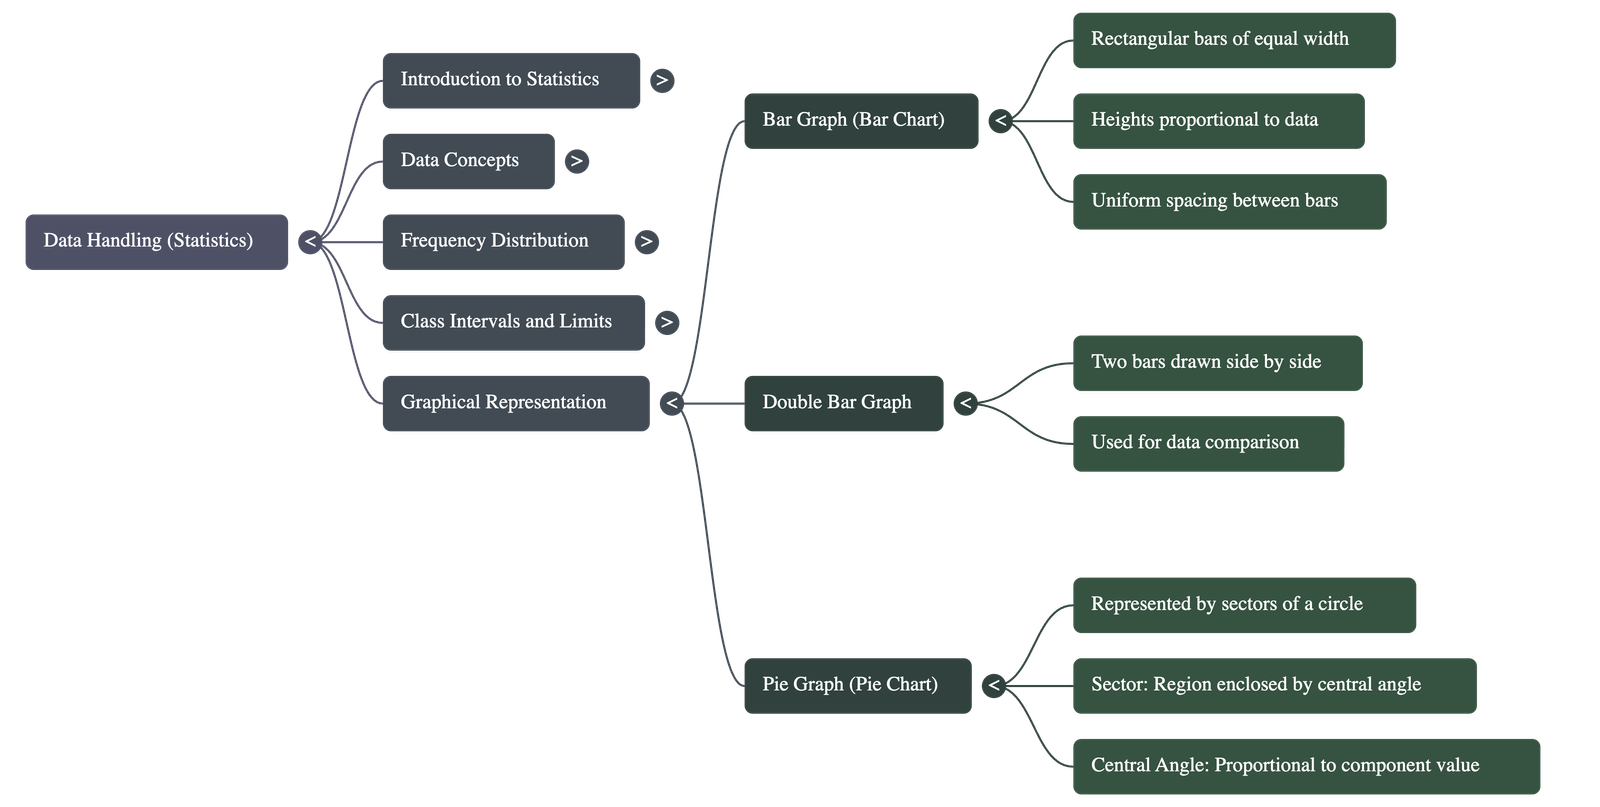
4. Graphical Representation: Bar Graphs
- Bar Graph (Bar Chart): A visual representation using rectangular bars of equal width.
- Properties:
- The width of the bars does not represent any value; only the height represents the data.
- The heights are directly proportional to the frequency or value they represent.
- Equal space must be left between consecutive bars.
- Double Bar Graph: Two bar graphs drawn side-by-side to compare two collections of data (e.g., comparing the number of boys and girls in different classes).
5. Graphical Representation: Pie Charts
- Pie Graph (Pie Chart): Numerical data represented by the sectors of a circle.
- Sector: The region of the circle enclosed by two radii and an arc.
- Central Angle: The angle formed at the center of the circle by the two radii of a sector. The sum of all angles about the center is 360°.
- Construction: To draw a pie chart, the value of each component is converted into a proportionate angle.
Central Angle of a Component = (Value of Component / Total Value) × 360°
Quick Navigation:
| | | | |
1 / 1
Quick Navigation:
| | | | |