Quick Navigation:
| | | | |
Quick Navigation:
| | | | |
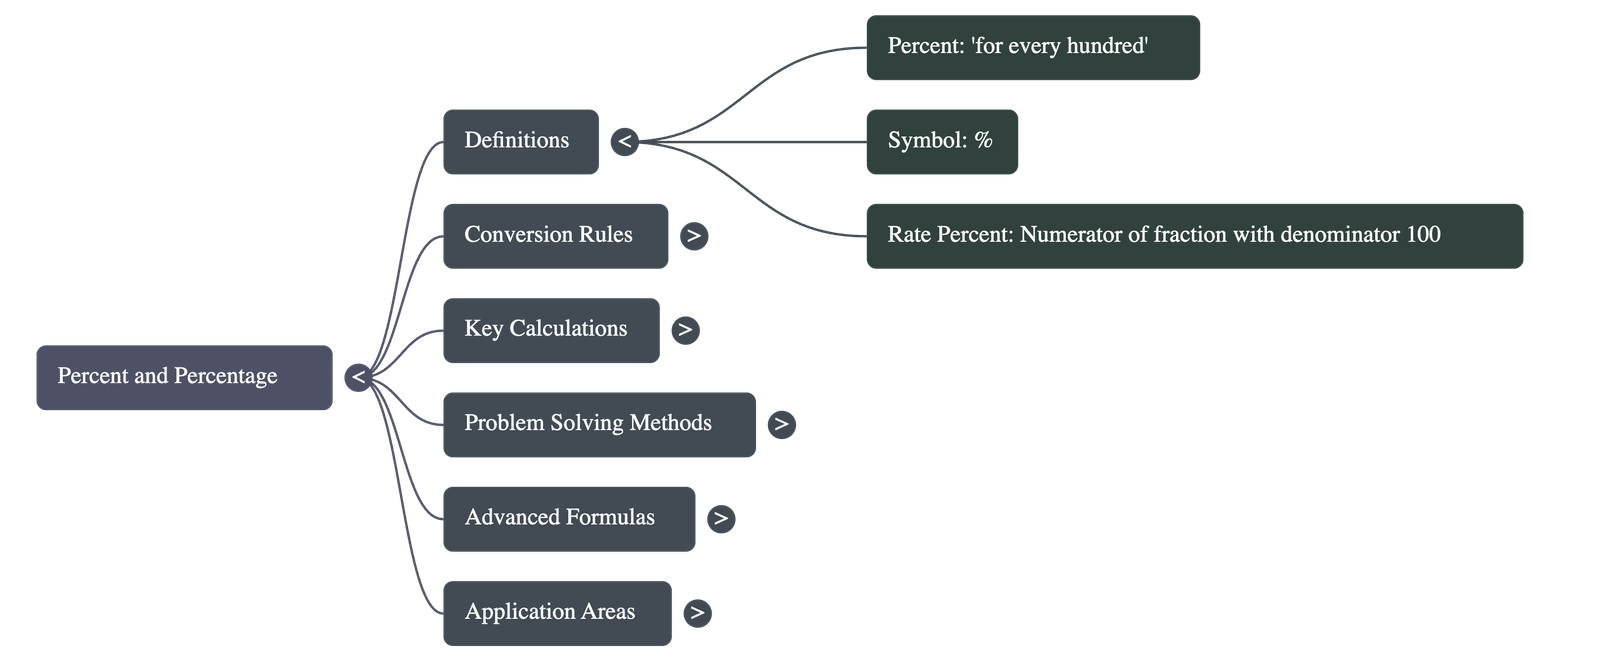
1. Fundamental Definitions
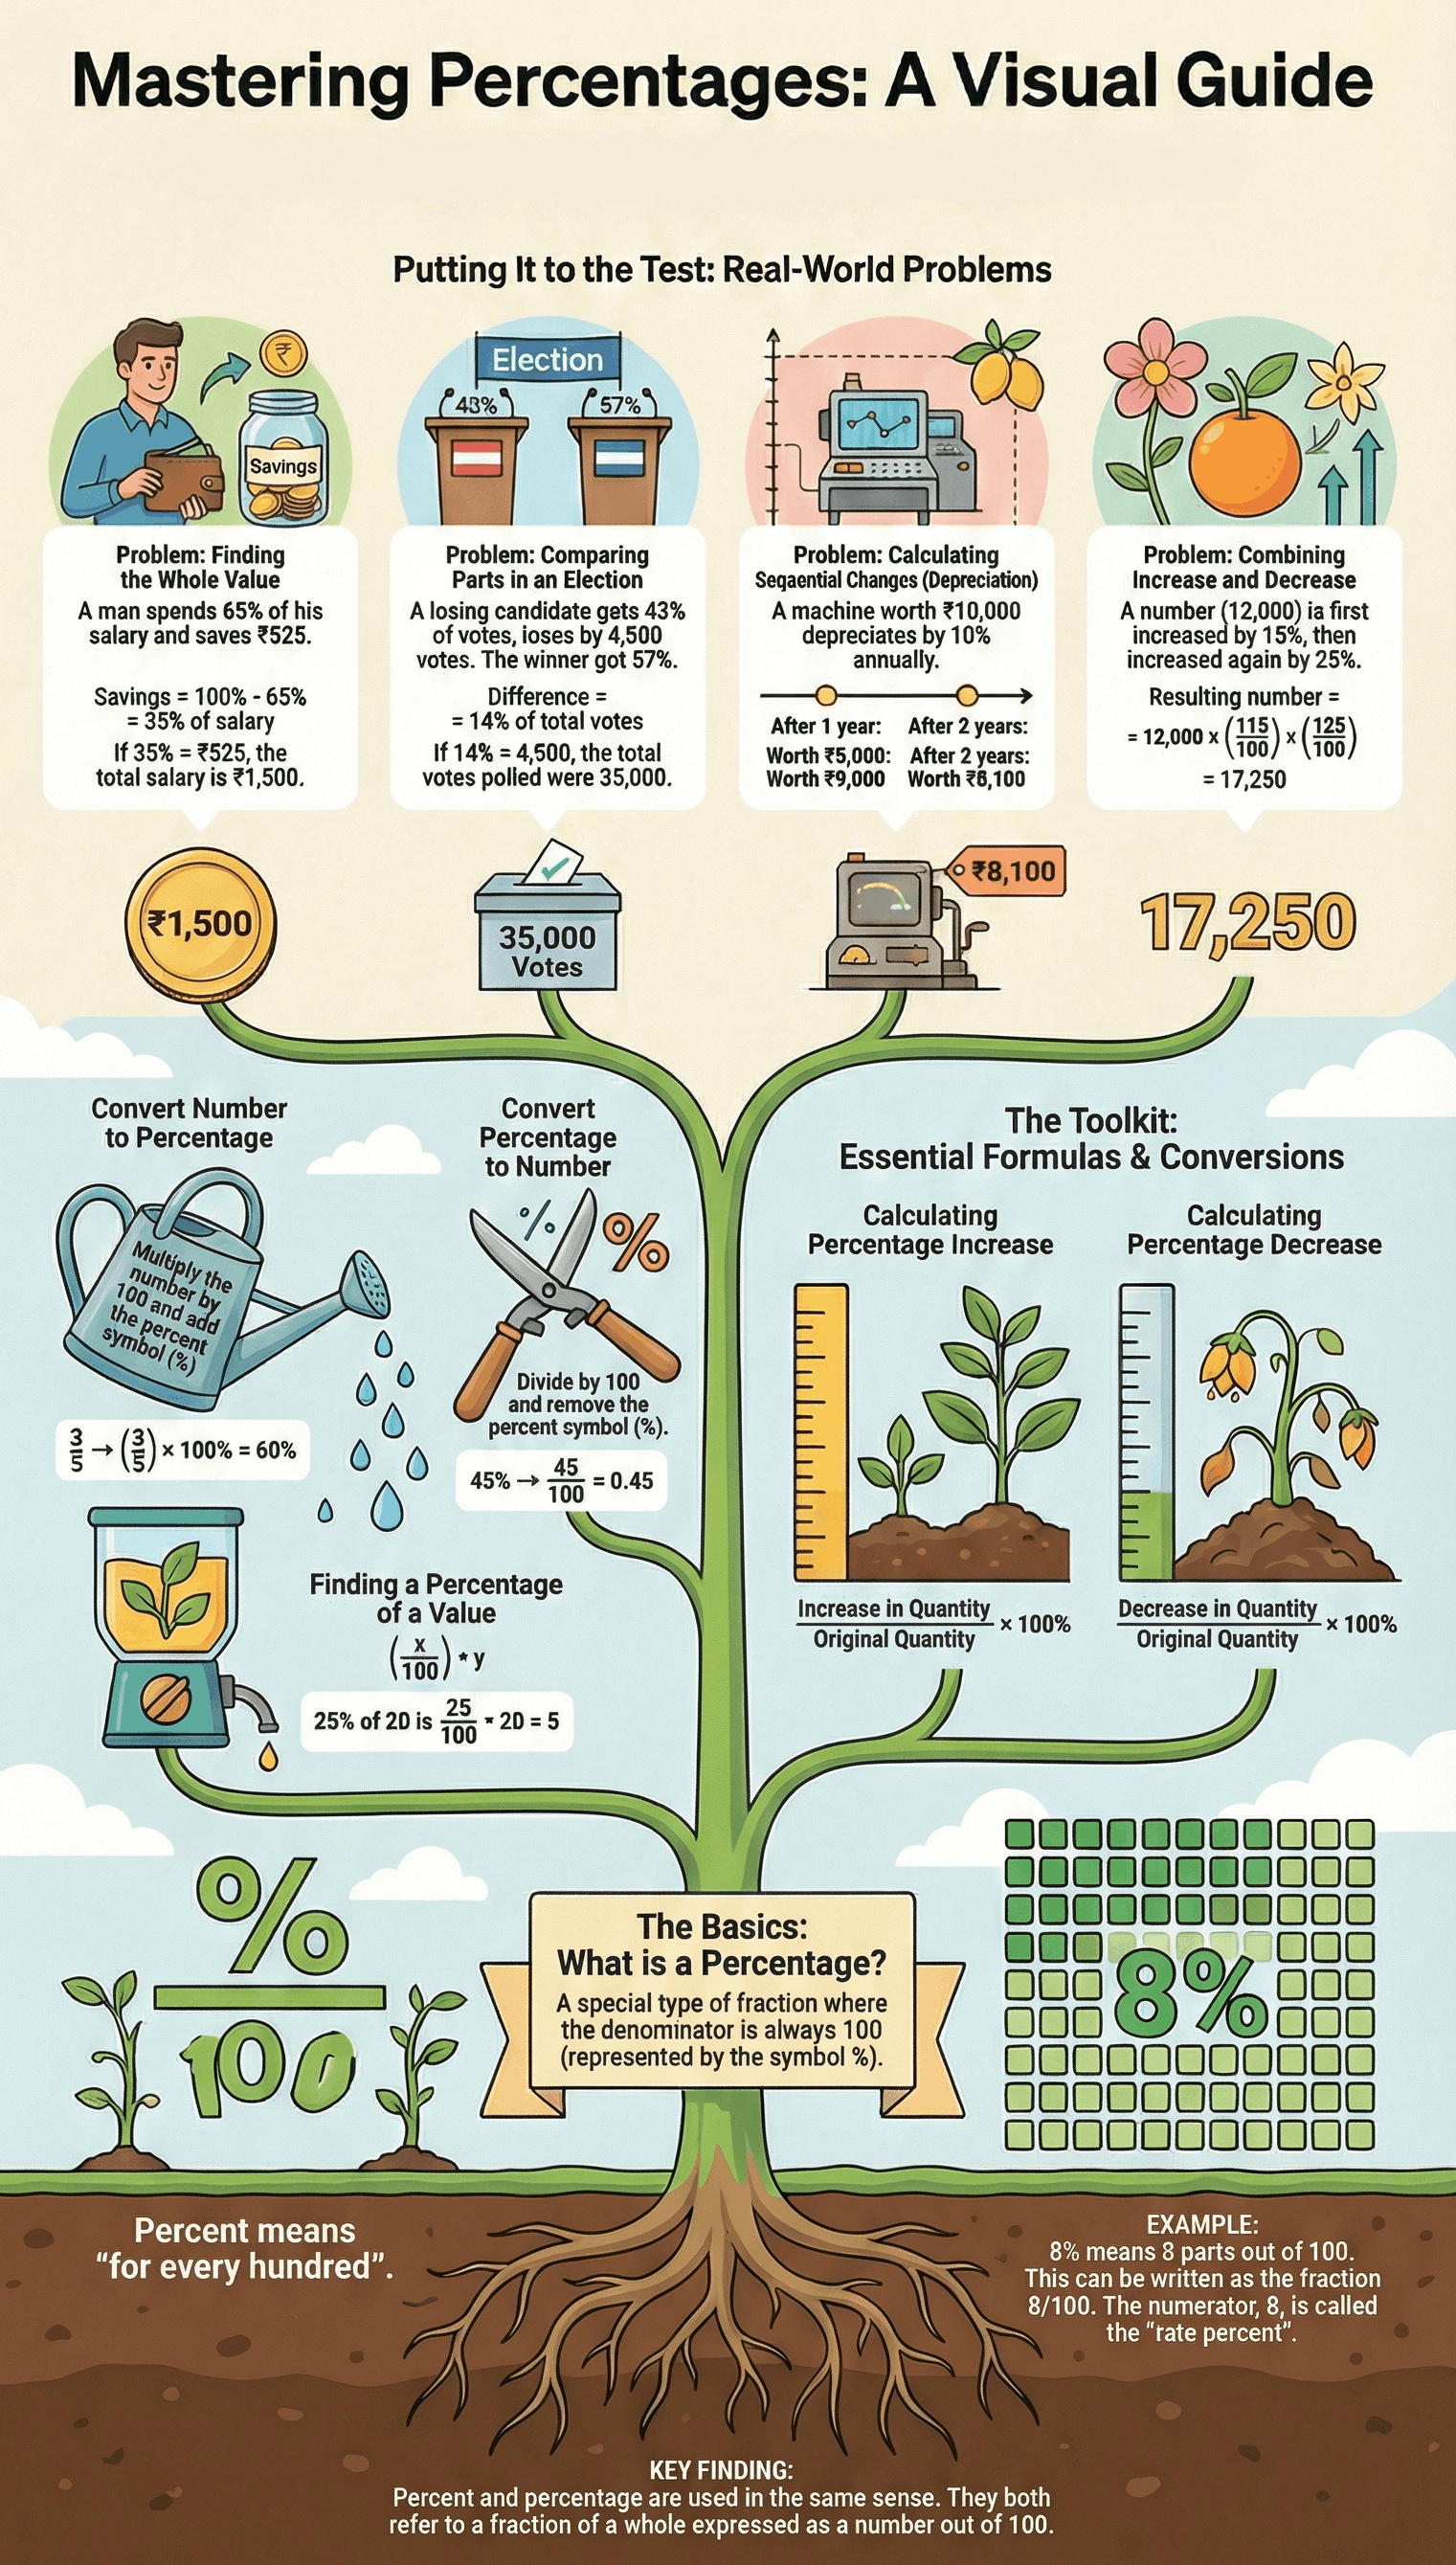
- Percent: The term means "for every hundred." It is often abbreviated as "p.c." and represented by the symbol %.
- Percentage: Technically, this is a fraction with a denominator of 100. The numerator of this fraction is known as the rate percent. In general practice, "percent" and "percentage" are used interchangeably.
2. Basic Conversions
- To Percent: To convert a fraction or a decimal into a percentage, multiply the value by 100 and attach the % sign.
- From Percent: To convert a percentage back into a fraction or decimal, divide the number by 100 and remove the % sign.
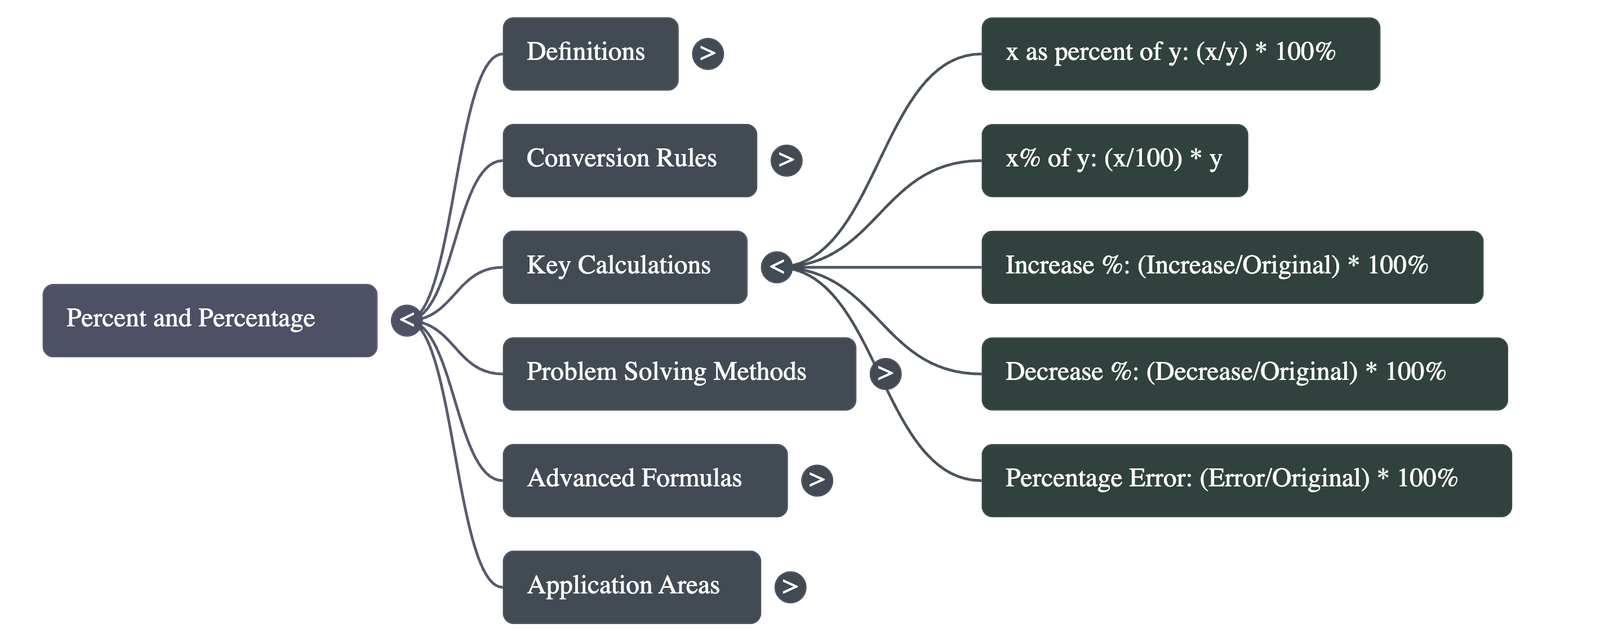
3. Core Mathematical Formulas
- Finding a Percentage of a Total: To find what percent x is of y, use the formula:
(x / y) × 100%. - Finding Value from a Rate: To find a specific percentage (x%) of a quantity (y), use:
(x / 100) × y. - Increase and Decrease:
- Increase %: (Increase in quantity / Original quantity) × 100%
- Decrease %: (Decrease in quantity / Original quantity) × 100%
- Percentage Error: This is calculated as (Error / Original number) × 100%.
4. Problem-Solving Methodologies
The chapter demonstrates that most percentage problems can be solved using three distinct approaches:
- Direct Method: Applying formulas directly to the numbers provided.
- Unitary Method: Calculating the value for a single unit (or assuming a base of 100) and then scaling to find the final answer.
- Algebraic Method: Assigning a variable (such as x) to the unknown value and solving the resulting linear equation.
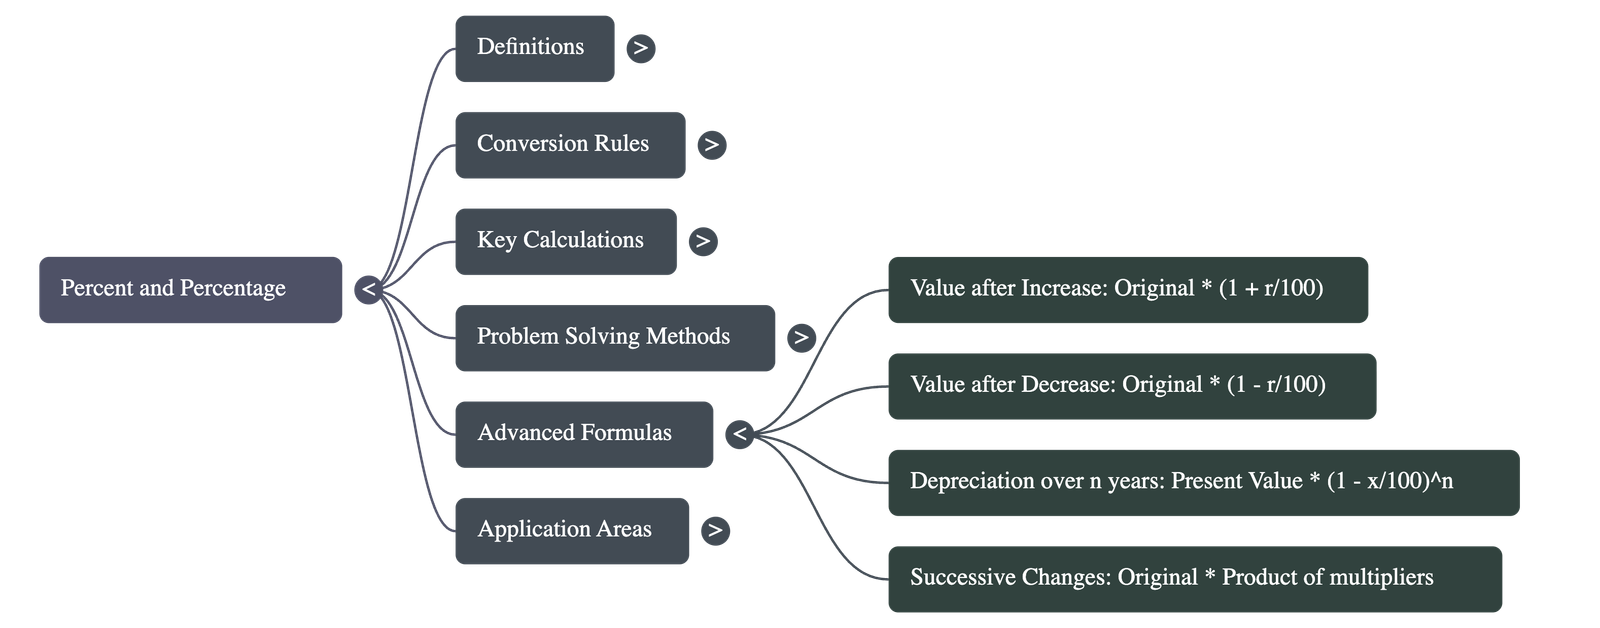
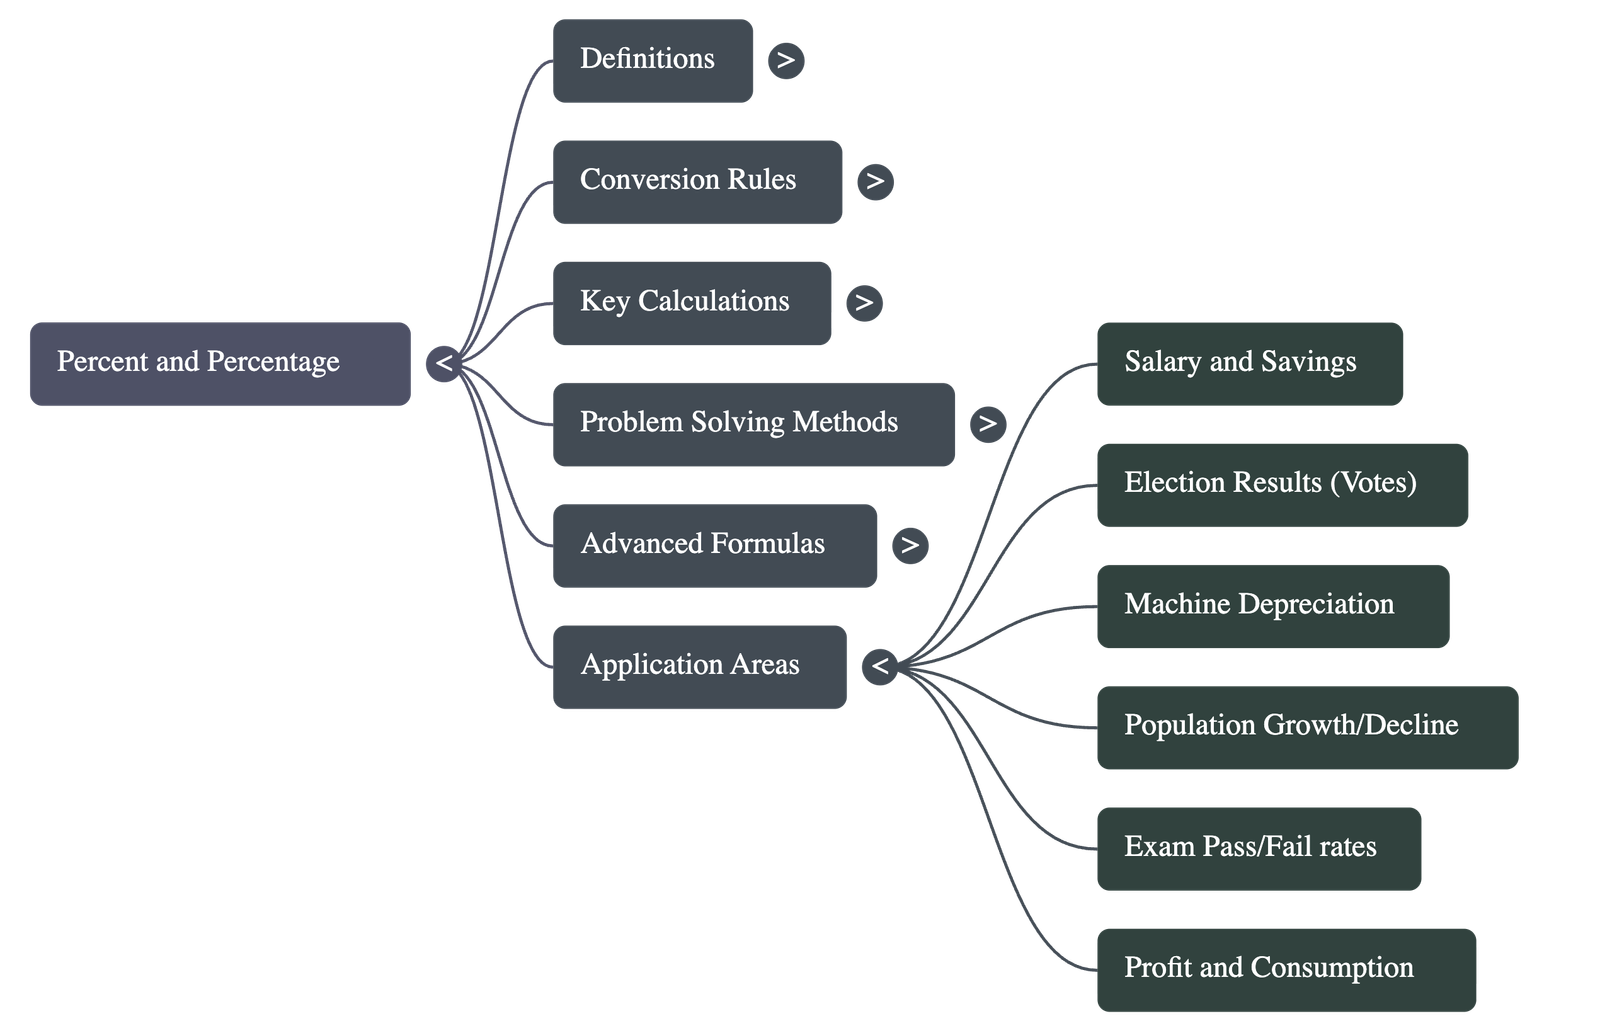
5. Advanced Applications
- Depreciation and Appreciation: For items like machines or property that change value annually by x%, the new value is calculated by multiplying the present value by
(1 + x/100)for increases or(1 - x/100)for decreases. - Successive Changes: When a value undergoes multiple changes (e.g., a 10% decrease followed by a 20% increase), the final result is found by multiplying the original number by each successive change factor.
- Comparison Problems: The chapter provides methods to determine the percentage difference between two entities, such as how much percent one person's income is less than another's if the first person's is more.
- Venn Diagrams: These are utilized to solve complex scenarios involving overlapping groups, such as students who fail in one or more specific subjects in an examination.
- Price and Expenditure: Calculations are provided for determining how much consumption must be reduced to keep total expenditure the same when the price of a commodity increases.
Quick Navigation:
| | | | |
1 / 1
Quick Navigation:
| | | | |