Quick Navigation:
| | | |
Graphical Solution
[Solution of Simultaneous Linear Equations, Graphically]
24.1 Graphs of Linear Equations in Two Variables
What is a Linear Equation?
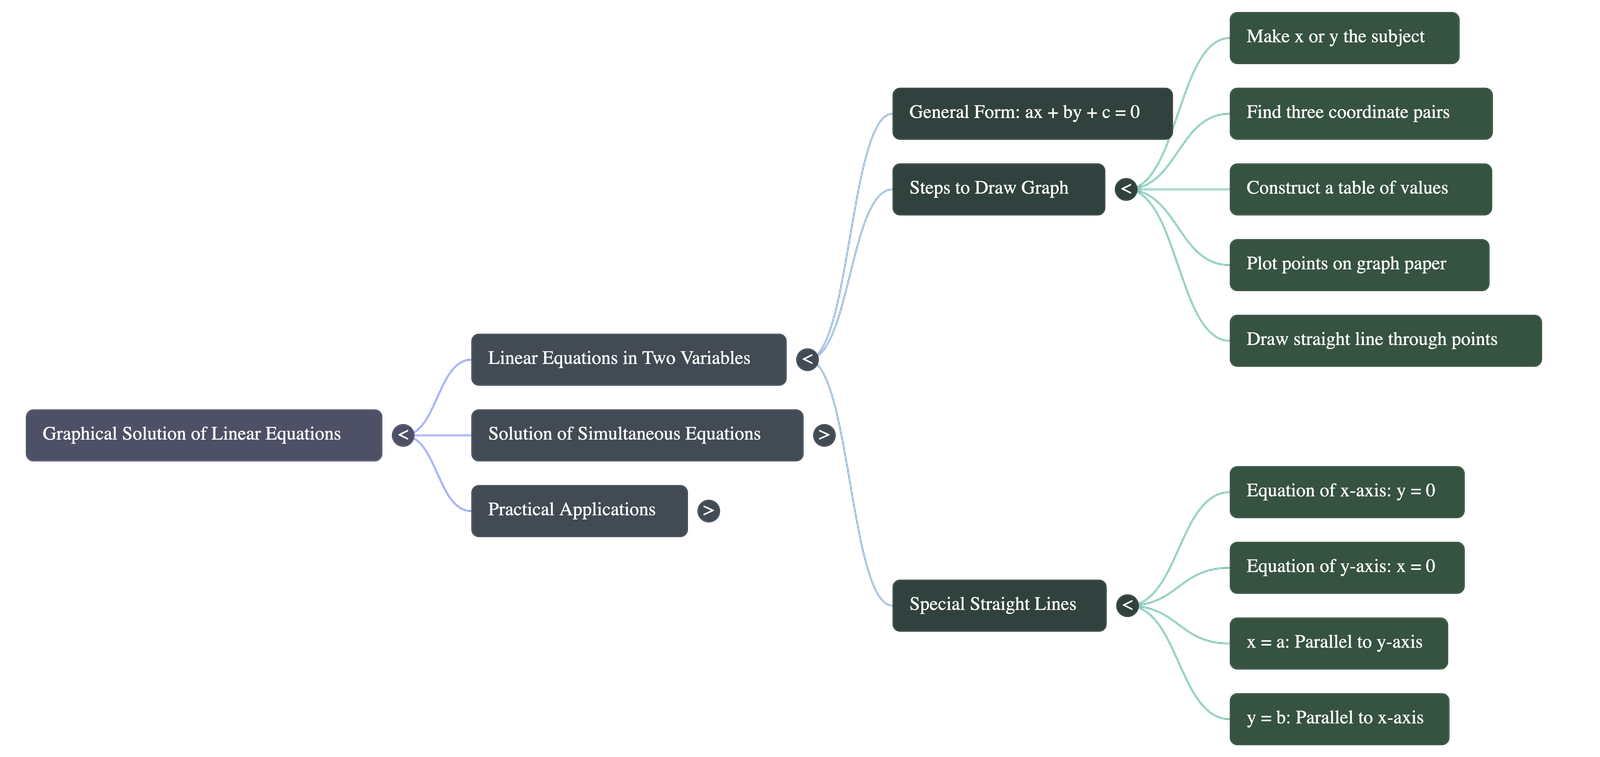
- An equation written in the form ax + by + c = 0 is known as a linear equation in two variables.
- Here, x and y are the variables, while a, b, and c are constant numbers.
Steps to Draw the Graph of a Linear Equation:
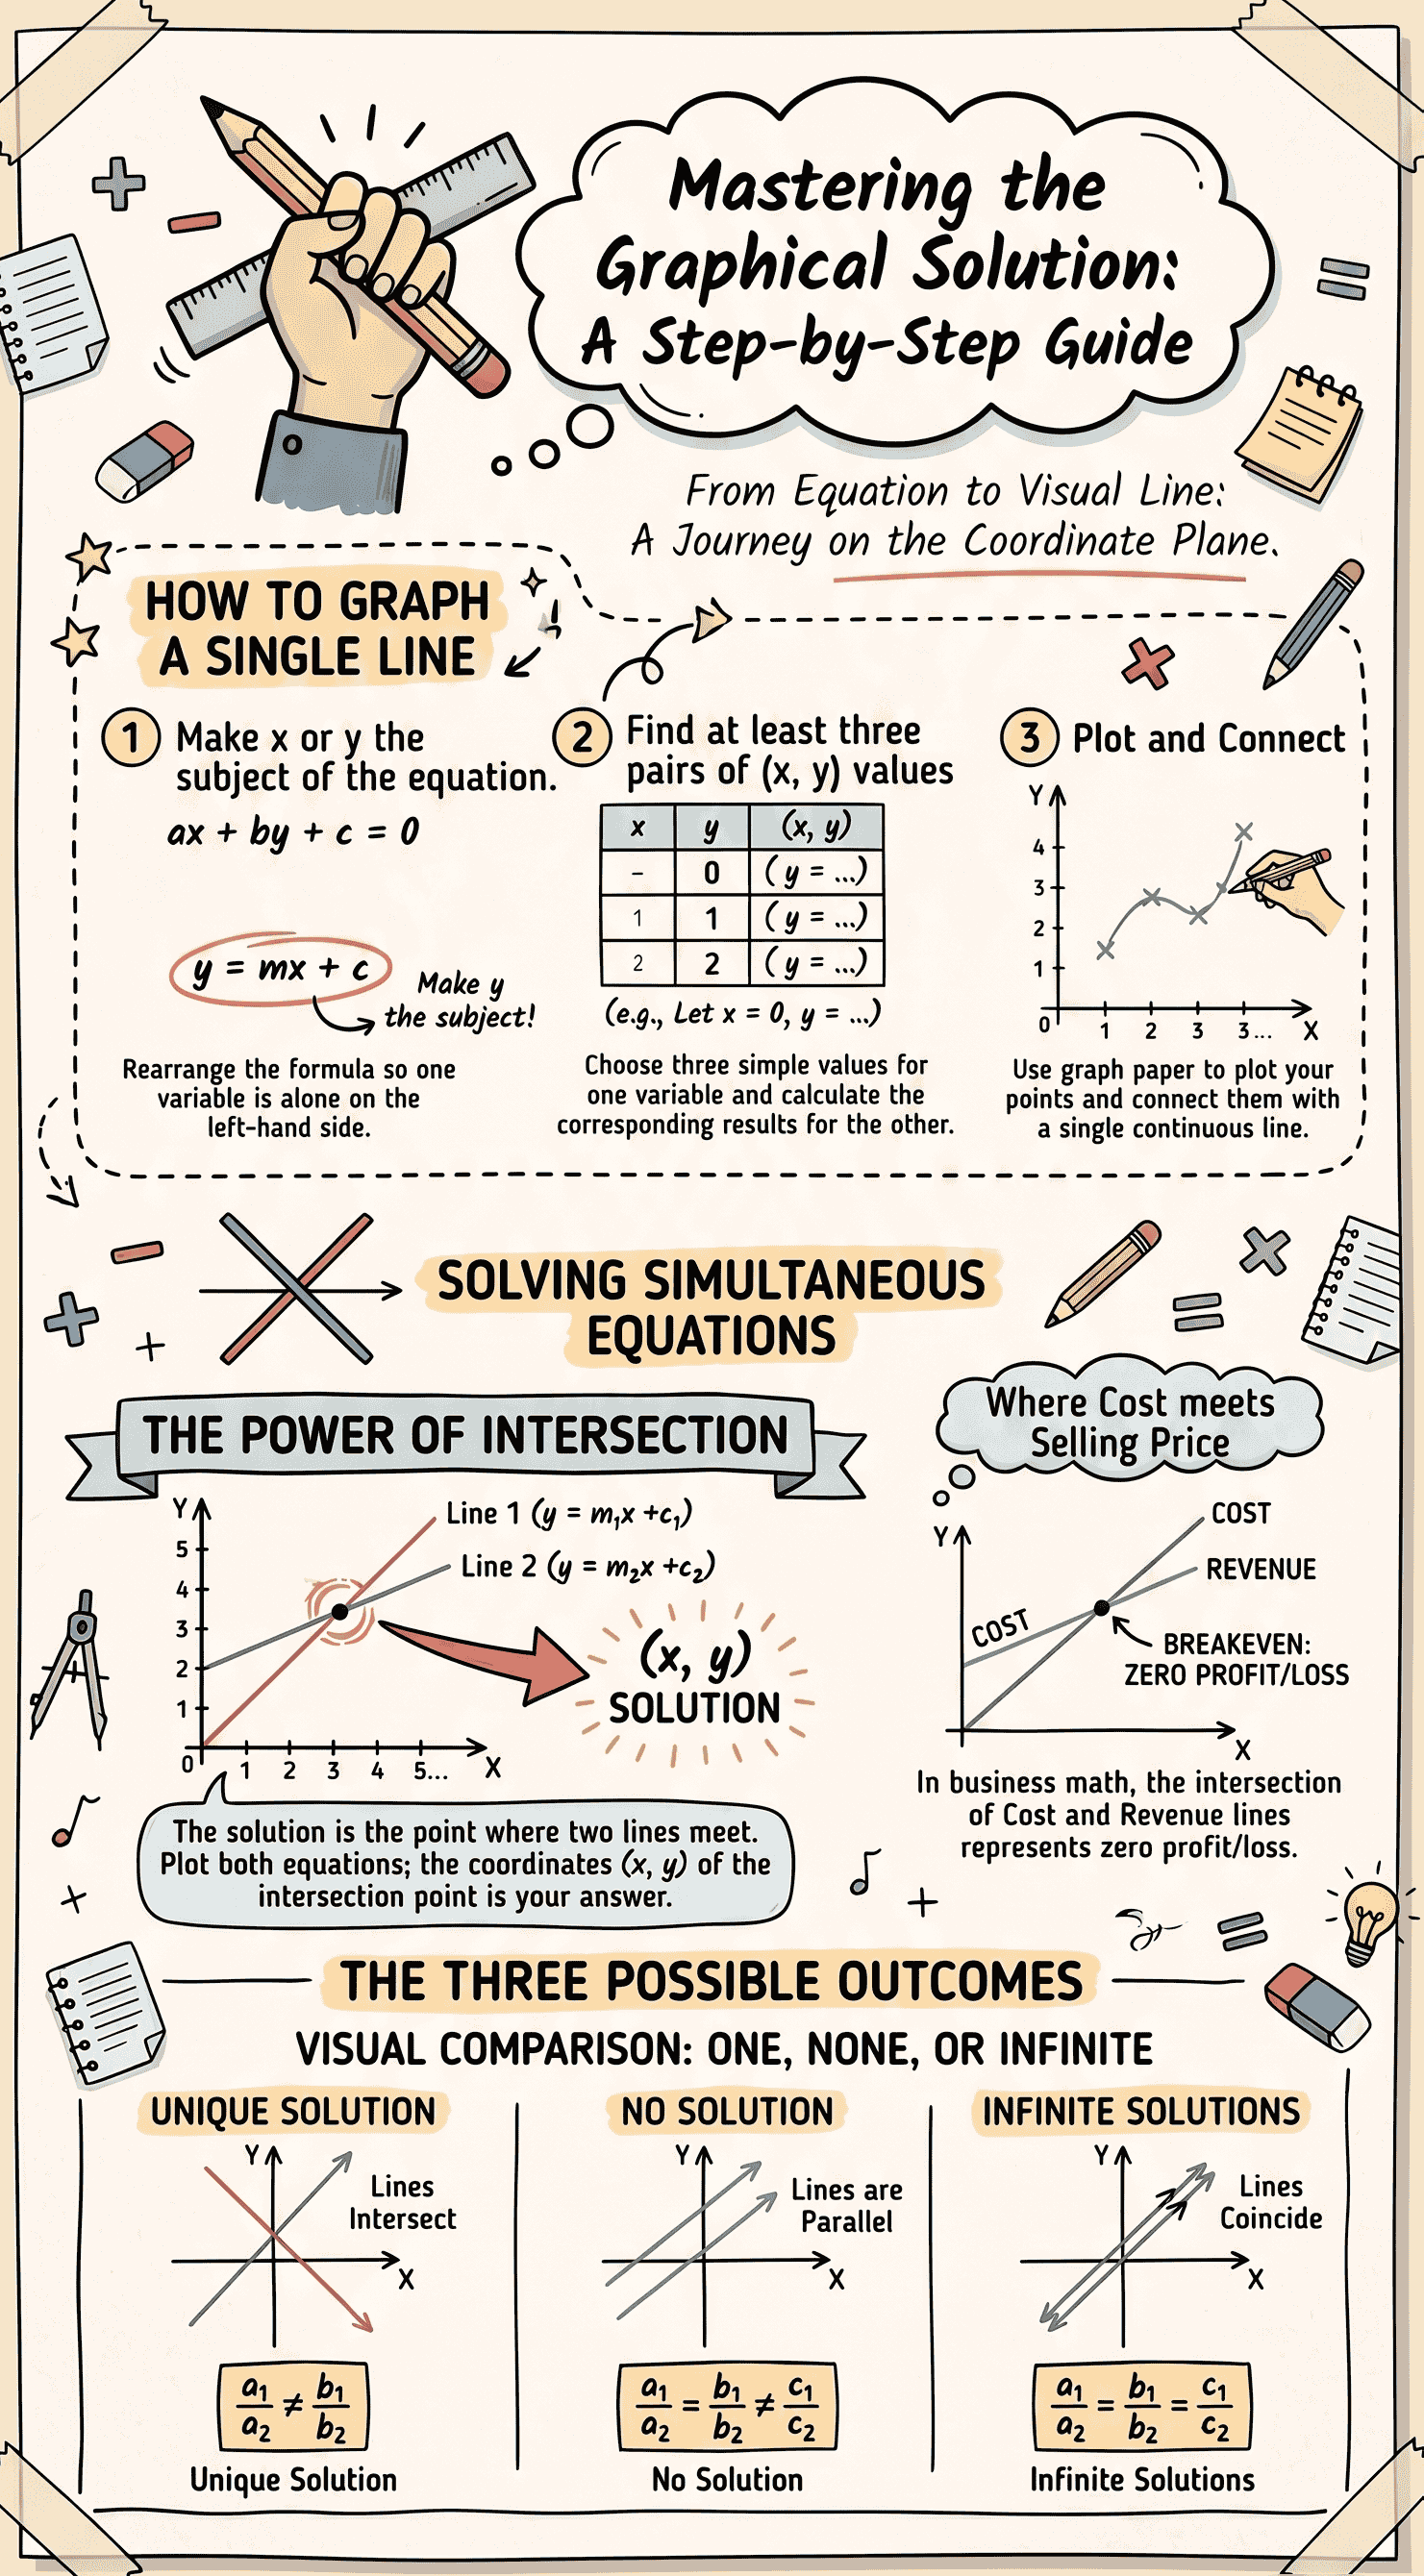
- Make x or y the subject: Rearrange the equation so that either x or y is completely alone on one side of the equals sign.
- Substitute values: Choose at least three easy, suitable values for the variable on the right-hand side. Calculate to find the matching values for the variable on the left-hand side.
- Create a table: Construct a clear table to write down your different pairs of x and y values.
- Plot the points: Take at least three ordered pairs (points) from your table and plot them accurately on a graph paper.
- Draw the line: Use a ruler to draw a straight line that passes directly through all the plotted points.
Important Facts to Remember
- The equation of the x-axis is always y = 0.
- The equation of the y-axis is always x = 0.
- If you have an equation like x = a (where 'a' is just a number), its graph is a straight line perfectly parallel to the y-axis, positioned 'a' units away from it.
- Similarly, if you have an equation like y = b (where 'b' is a number), its graph is a straight line parallel to the x-axis, positioned 'b' units away from it.
24.2 Solution of Simultaneous Linear Equations Graphically
Steps to Solve Two Equations Together:
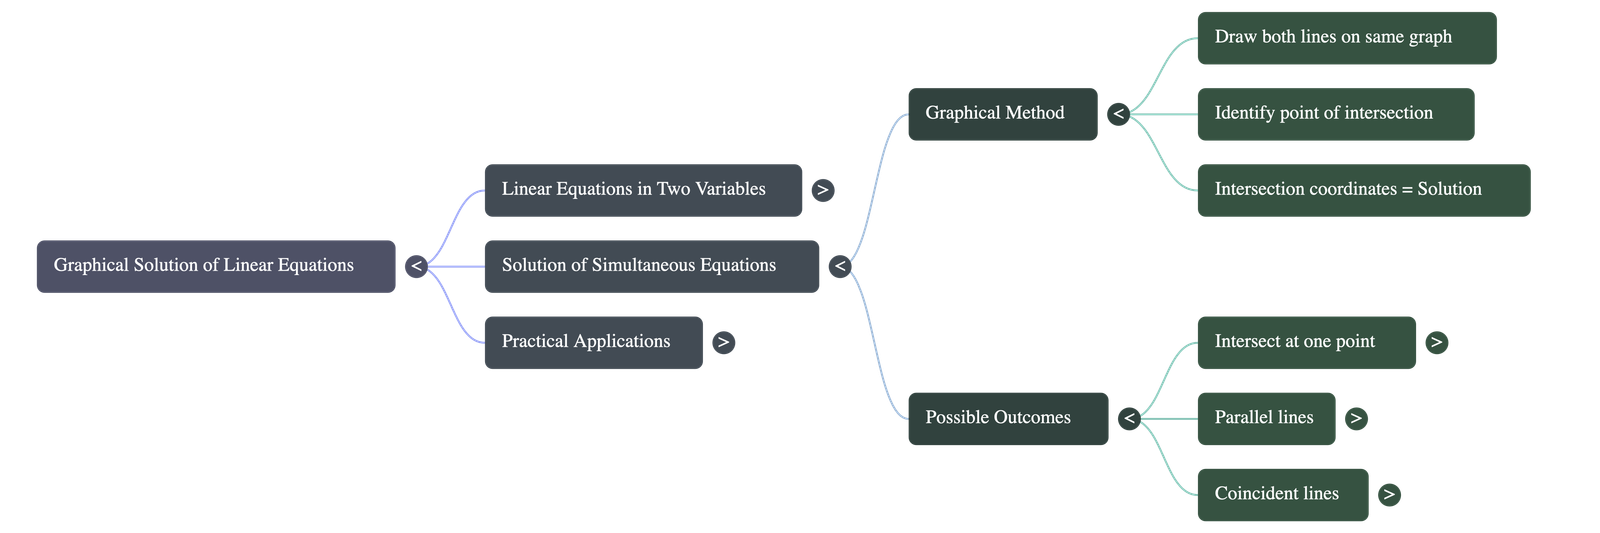
- Draw both graphs: Using the steps learned in section 24.1, draw a straight line for each of the given equations on the very same piece of graph paper.
- Find the intersection: Look at your graph and pinpoint exactly where the two straight lines cross (intersect) each other.
- Identify the solution: The (x, y) coordinates of this unique point of intersection give you the final solution that satisfies both equations.
Real-World Applications of Graphs
- Calculating Area: You can use the graph to find the area of geometric shapes formed by the lines (like a triangle formed by two intersecting lines and an axis). You simply count the units on the graph to find the base and height, then use the formula: Area = ½ × base × height.
- Finding the Breakeven Point: In business problems, you can plot two lines: one for the Cost Price (money spent) and one for the Selling Price (money earned). The exact point where these two lines intersect is called the breakeven point. At this point, there is no profit and no loss.
Three Possibilities of Linear Equations (Nature of Solutions)
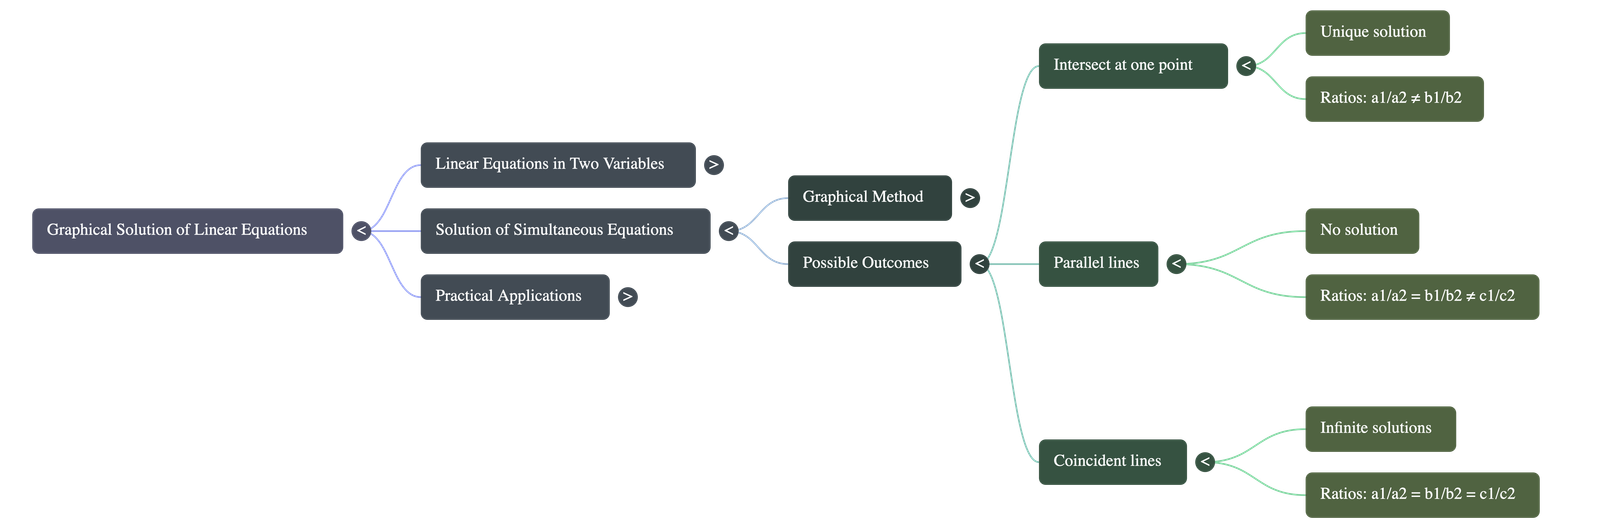
When you have two linear equations, say a₁x + b₁y + c₁ = 0 and a₂x + b₂y + c₂ = 0, drawing them will always result in one of three scenarios. You can even predict the result by checking the ratio of their numbers:
-
1. Intersecting Lines (Unique Solution)
If a₁/a₂ ≠ b₁/b₂, the two lines will cross at exactly one single point. This means the equations have exactly one unique answer. -
2. Parallel Lines (No Solution)
If a₁/a₂ = b₁/b₂ ≠ c₁/c₂, the two lines will run parallel to each other forever and never touch. Because they never cross, the equations have absolutely no solution. -
3. Coincident Lines (Infinite Solutions)
If a₁/a₂ = b₁/b₂ = c₁/c₂, the two equations actually represent the exact same line. One line lies completely on top of the other. Because they touch everywhere, there are infinite (endless) solutions.
Do checkout all questions & answers of this chapter.
Quick Navigation:
| | | |
1 / 1
Quick Navigation:
| | | |