Quick Navigation:
| | |
Chapter 13: Statistics
1. Introduction
- The chapter extends the study of measures of central tendency—mean, median, and mode—from ungrouped data (studied in previous classes) to grouped data.
- It introduces the concept of cumulative frequency and cumulative frequency distributions.
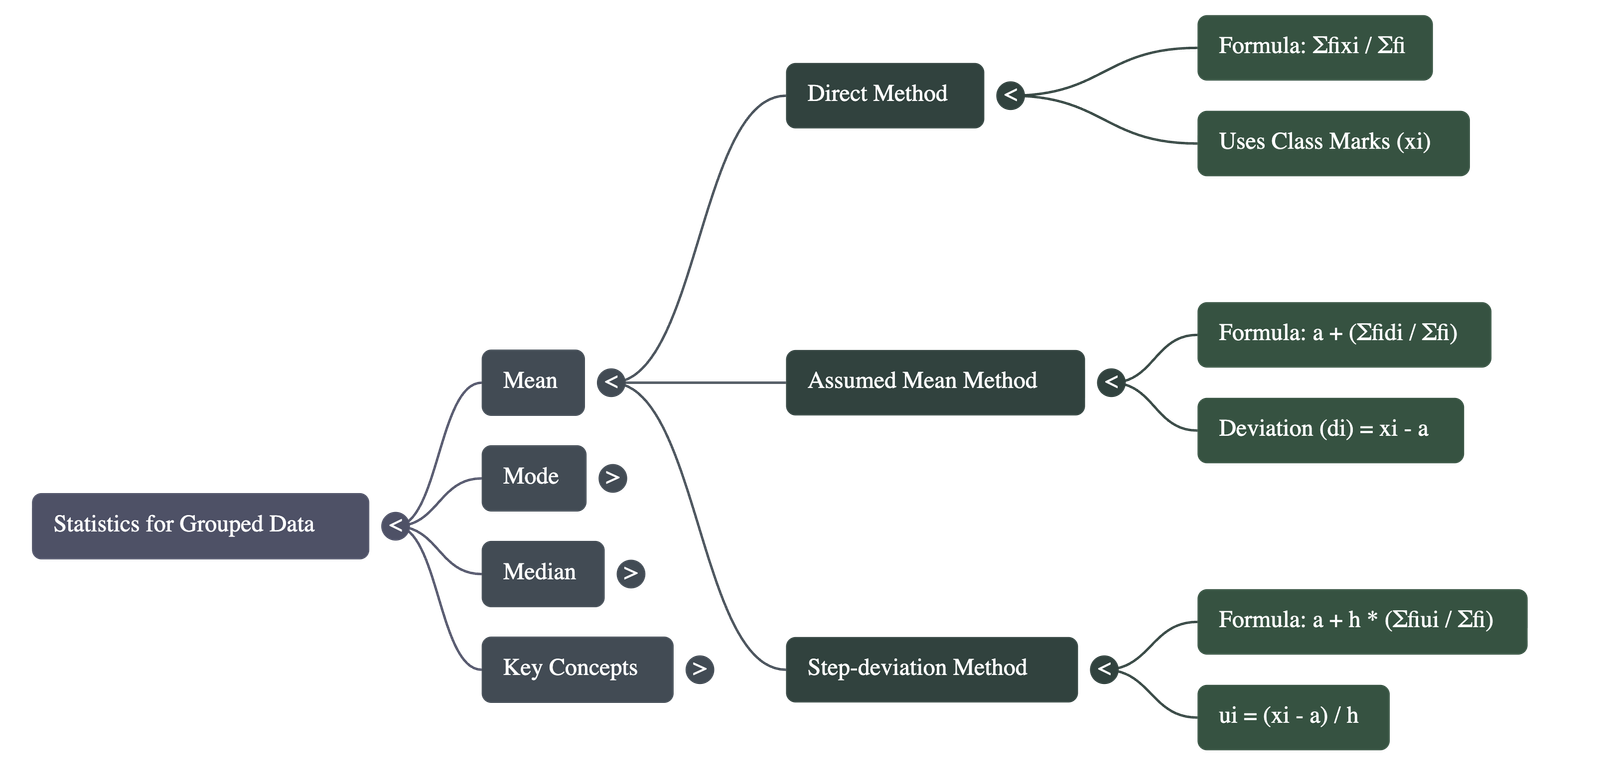
2. Mean of Grouped Data
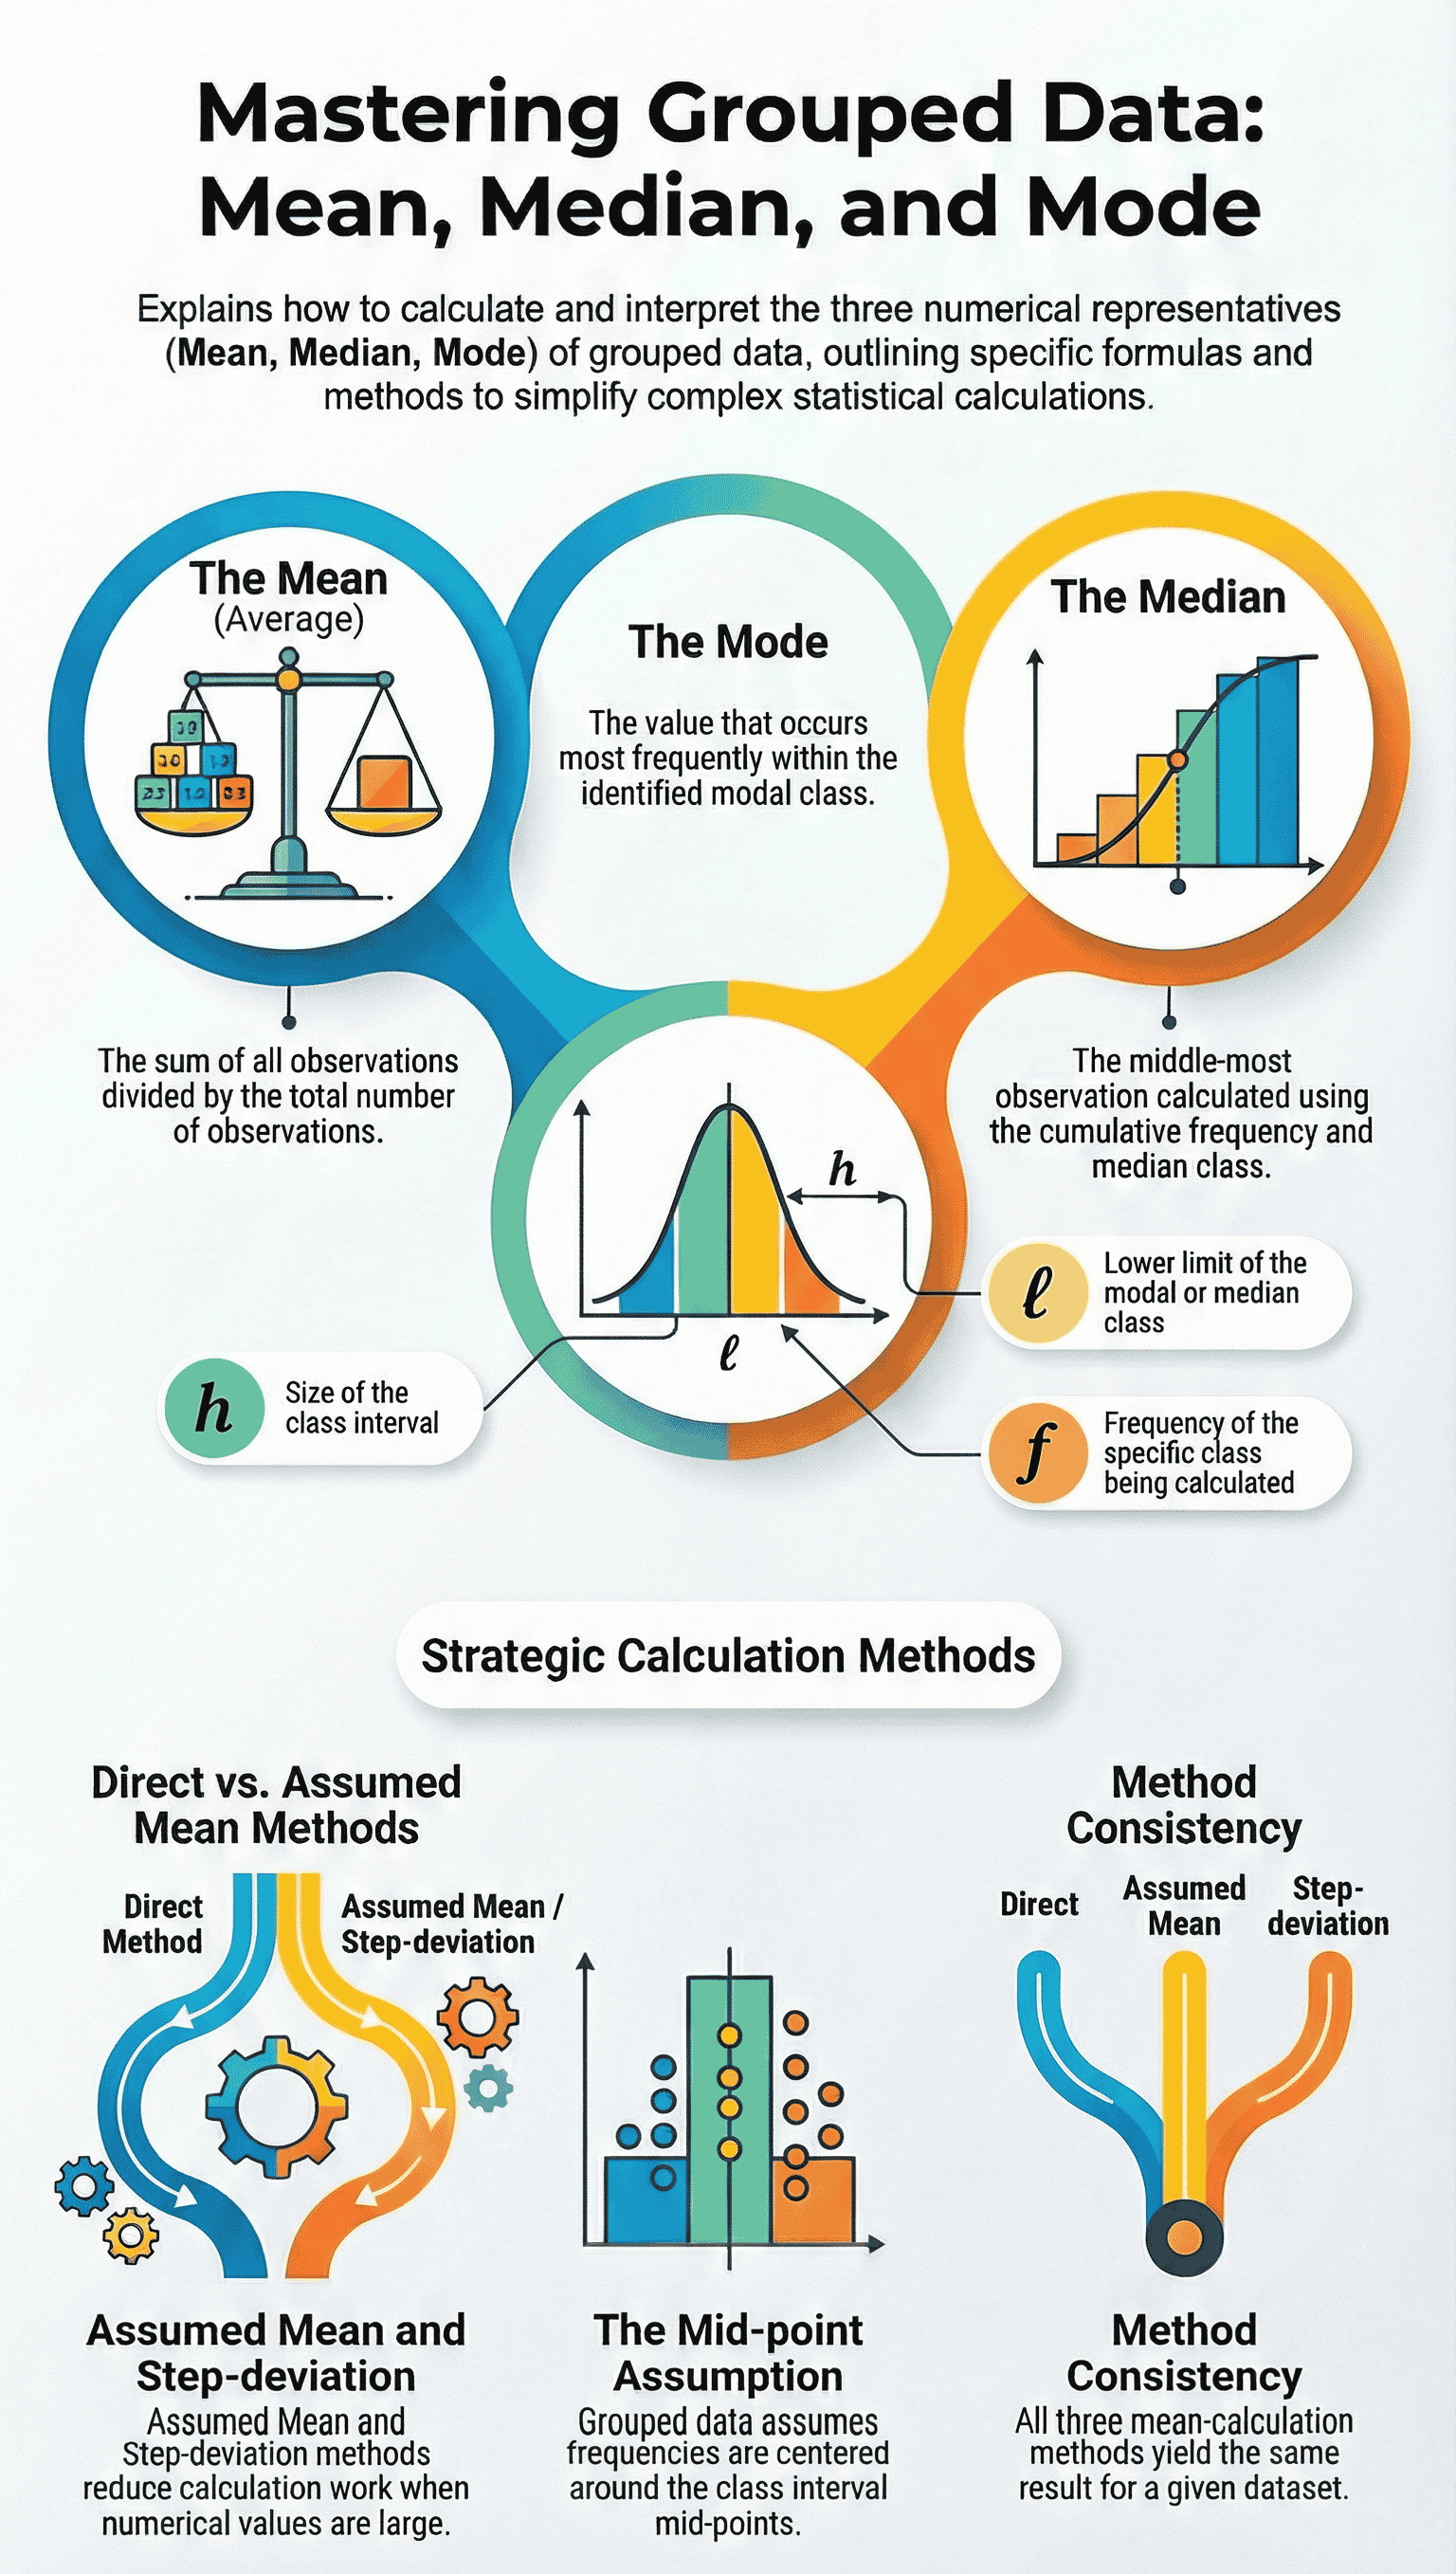
The mean (average) is the sum of the values of all observations divided by the total number of observations. For grouped data, three methods are discussed:
A. Direct Method
- First, find the Class Mark ($x_i$) for each class interval, which serves as the representative of the whole class.
- Class Mark Formula: $\text{Upper class limit} + \text{Lower class limit} \over 2$
- Mean Formula ($\bar{x}$):
$\bar{x} = \frac{\sum f_i x_i}{\sum f_i}$
B. Assumed Mean Method
- Used when numerical values of $x_i$ and $f_i$ are large to simplify calculations.
- An Assumed Mean ($a$) is chosen from the $x_i$ values (usually in the middle).
- Calculate the deviation $d_i = x_i - a$.
- Mean Formula:
$\bar{x} = a + \frac{\sum f_i d_i}{\sum f_i}$
C. Step-Deviation Method
- Further simplifies calculations if all deviations ($d_i$) share a common factor.
- Calculate $u_i = \frac{x_i - a}{h}$, where $h$ is the class size.
- Mean Formula:
$\bar{x} = a + (\frac{\sum f_i u_i}{\sum f_i}) \times h$
- Note: All three methods yield the same mean.
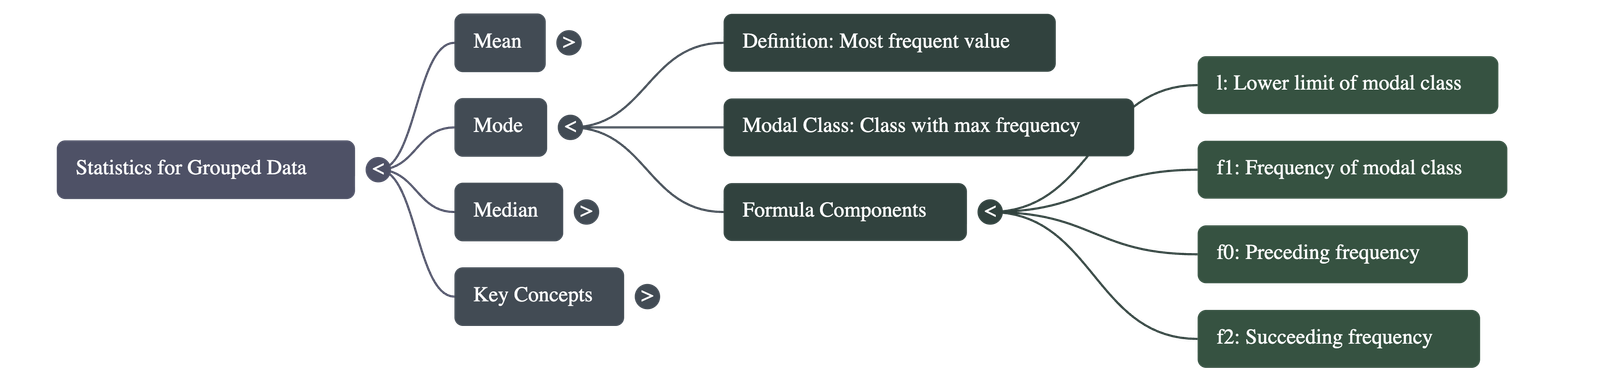
3. Mode of Grouped Data
- The mode is the value among the observations that occurs most often.
- In grouped data, we first identify the Modal Class, which is the class with the maximum frequency.
- Mode Formula:
$\text{Mode} = l + (\frac{f_1 - f_0}{2f_1 - f_0 - f_2}) \times h$
- Where:
- $l$ = lower limit of the modal class
- $h$ = size of the class interval (assuming equal sizes)
- $f_1$ = frequency of the modal class
- $f_0$ = frequency of the class preceding the modal class
- $f_2$ = frequency of the class succeeding the modal class
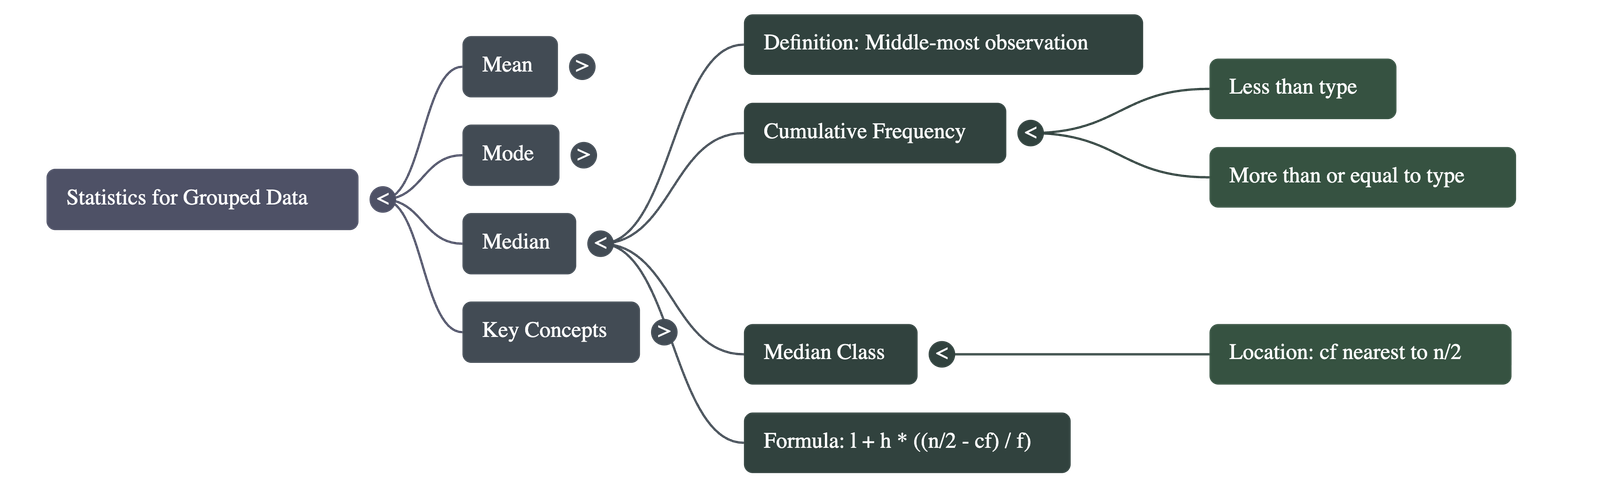
4. Median of Grouped Data
- The median is the middle-most observation in the data.
- To find the median for grouped data, Cumulative Frequency (cf) is required.
- There are two types of cumulative frequency distributions: "less than type" and "more than type".
- Median Class: The class interval whose cumulative frequency is greater than and nearest to $\frac{n}{2}$ (where $n$ is the total number of observations).
- Median Formula:
$\text{Median} = l + (\frac{\frac{n}{2} - cf}{f}) \times h$
- Where:
- $l$ = lower limit of the median class
- $n$ = number of observations
- $cf$ = cumulative frequency of the class preceding the median class
- $f$ = frequency of the median class
- $h$ = class size (assuming equal sizes)
5. Summary of Key Concepts
- Empirical Relationship: There is an empirical relationship between the three measures of central tendency:
3 Median = Mode + 2 Mean
- Comparison of Measures:
- Mean: Best used when all observations are important and for comparing two distributions. However, it is affected by extreme values.
- Median: Best used when individual observations are not important, and a "typical" observation is needed. It is a better measure when extreme values are present.
- Mode: Best used to find the most popular item or the most frequent value.
- Continuous Classes: For calculating mode and median, class intervals must be continuous. If there are gaps (e.g., 1-10, 11-20), they must be converted to continuous classes (e.g., 0.5-10.5, 10.5-20.5).
Quick Navigation:
| | |
1 / 1
Quick Navigation:
| | |